|
|||||||||||||||
|
Name
Cash Bids
Market Data
News
Ag Commentary
Weather
Resources
|
What Does Seasonal Analysis Tell Us About Grains This Fall?
Welcome to the first trading day of meteorological fall. If you are one who celebrates the turning of the season with pumpkin spice anything and everything, you’ve been waiting for the end of the Dog Days of Summer with great anticipation. (I know others have skipped fall altogether and gone straight to Christmas music. But these folks likely have holiday tunes playing year-round.) Now that we are officially in meteorological fall (September-October-November), let’s take a look at what some of our key markets in the Grains sector do over the next three months by using seasonal indexes. Recall I like to use indexes rather than flat price, showing me the normal percent change (distance element) over a certain period of time (time element). Today I’ll be focusing on December Corn futures, November Soybean futures and the National Soybean Index (national average cash price), and the National SRW Wheat Index. 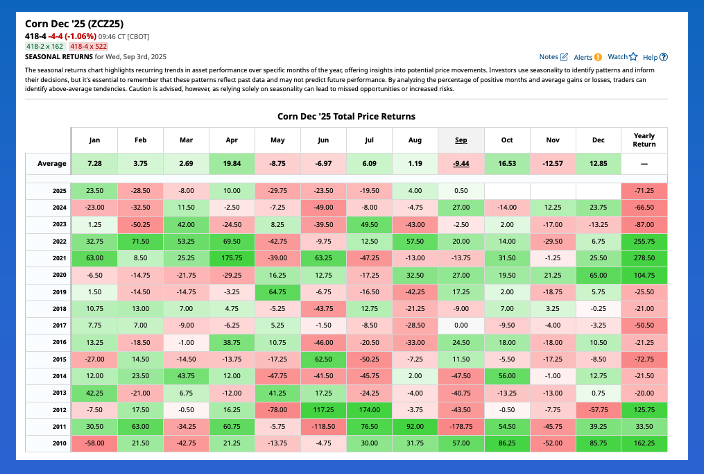 As usual, I’ll start with December corn (ZCZ25). You’ll recall from previous analysis that Dec corn tends to post a low weekly close the fourth week of August. This time around, Dec25 is showing a low weekly close of $4.0525 from the third week of August. If we apply the Horseshoe Proximity we can say close is close enough. We are also dealing with averages, and this year’s low looks to be in the ballpark. From there, December corn tends to rally through the end of November.
A couple things to keep in mind:
 Next up in the batting order (yes, September is still baseball season) is the November soybean futures contract (ZSX25). November soybeans do not have as clear of a seasonal pattern during the fall season (September-October-November) as December corn futures. Again, we have to keep in mind a couple important factors:
With that out of the say, let’s look at the seasonal patterns of Nov soybeans, such as they are:
Meanwhile, the National SRW Wheat Index ($CSWI) tends to post a low weekly close the fourth week of August, or the next to last week. Seasonally, the Index tends to lose between 13% (10-year index) and 16% (5-year index) from its normal high weekly close the second week of June through its normal seasonal low. The 2025 move saw the Index drop 14% from its high weekly close of $5.19 the third week of June through the low weekly close of $4.48 on Friday, August 22, the fourth weekly close of the month. From a Seasonal Analysis point of view, the Index fulfilled both the time and space elements of its normal pattern. What comes next, seasonally? From the fourth weekly close of August (this week) through the fourth weekly close of May the Index tends to gain between 13% (10-year) and 19% (5-year). Based on the low weekly close of $4.48 the upside target range for a high weekly close is between $5.06 and $5.33. Keep in mind the total cost of carry from late August through late May is roughly 92.5 cents meaning it would most likely not be profitable to hold cash bushels in commercial storage during the seasonal rally. But what about the fall season (September-October-November) specifically?
It should be a fun fall. On the date of publication, Darin Newsom did not have (either directly or indirectly) positions in any of the securities mentioned in this article. All information and data in this article is solely for informational purposes. For more information please view the Barchart Disclosure Policy here. |
|
|


